The new currency
User Profile Data
Wi-Fi analytics with user profile data is the new currency in the digital age. If the user has given their consent and can handle their personal data, Wi-Fi analytics is probably the most valuable asset a service provider can offer to business customers.
Don’t miss to explore Enea Aptilo Wi-Fi SMP and all its functions.
User-Friendly Wi-Fi Analytics
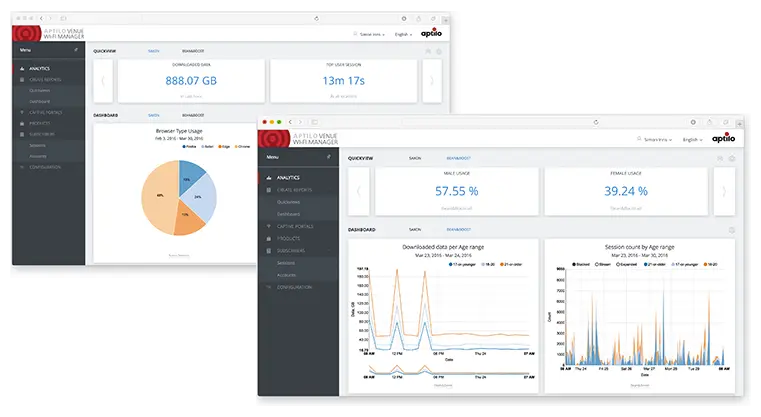
Wi-Fi Analytics. The award-winning Enea Aptilo SMP Venue Wi-Fi Manager user interface leverages the best of the latest web technology to provide an intuitive tool for the user. The Wi-Fi analytics view is no exception. It consists of a Quickview and Dashboard area, designed to be easy to use and understand for anyone.
Every user of the Wi-Fi analytics tool can create one or many Quickviews and Dashboards with only information that interests them. In the Quickview, they can add information displayed with a simple number or percentage. This provides a quick view of important data such as the percentage of iOS devices, female/male visitors, and the number of GB downloaded.
More complex data comparing several parameters or showing trends need graphical diagrams. These diagrams can be added to the Dashboard. There are several predefined Quickviews and Dashboards to select from, but users can also define their own.
The Quickview can be hidden with a simple click to make room for more diagrams in the Dashboard. You can also define the maximum number of diagram columns shown in the Dashboard. The actual number of columns shown depends on the screen size down to only one for a mobile device.
Graphs covering extended time periods can be magnified directly in the diagram to display a more granular view of a shorter period. There is no need to read an individual data point on the scale. Just hover the mouse pointer over the data point of interest, and the detailed figures will pop up. You can also hide data directly by clicking on its legend in the diagram. Only interested in one of the data sets? Just double-click on that data legend to hide all the rest.

Scalable by Design
For service providers selling managed guest Wi-Fi services, scalability is crucial as the number of daily sessions can easily add up to millions. Our analytics engine is designed for scalability and geographical redundancy. We use aggregated data provided through a REST-based API and third-party analytics applications can also use this API.
We have defined these aggregated reports based on the requirements of our 100+ operator customers over our 18 years in operation. But don’t worry. If we’ve missed something of importance to you, we can make a new aggregation available.
The aggregated reports include information about:
- User demographics
- Sessions
- Devices
- Login methods
- Usage and payments
- Comparison of Wi-Fi service products
- Selected data from our survey functionality
Our Wi-Fi analytics and captive portal manager are the cornerstones of the Enea Aptilo SMP Venue Wi-Fi Manager and the Enea Aptilo Guest Wi-Fi Cloud service.